When small misses become big losses
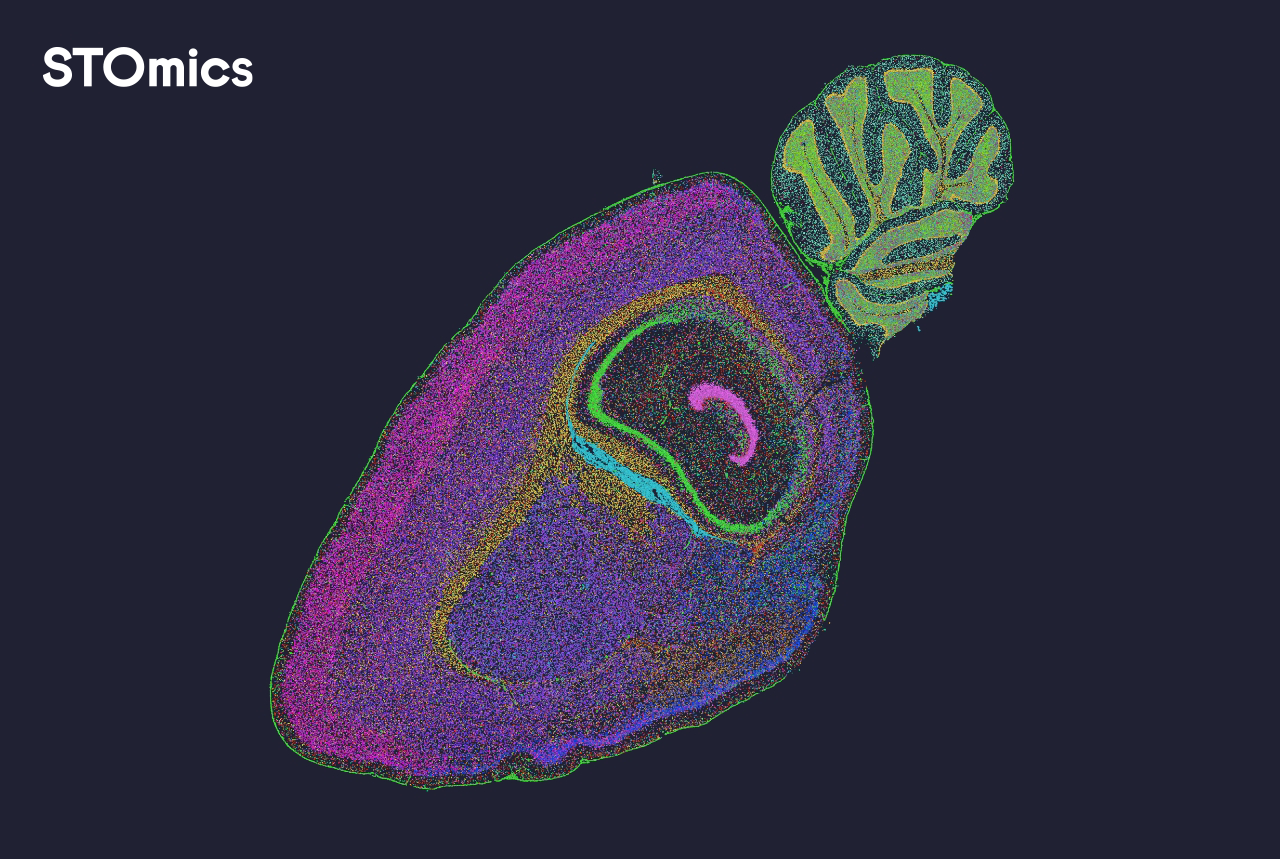
I once ran a week-long analysis on 10x Visium slides from a June 2023 tumor biopsy set—over 70% of barcodes showed ambiguous signal intensities; how much biology had slipped through the cracks? I say this because spatial omics software often masks these gaps behind pretty plots, and that illusion cost us a grant review. Early in that project I reached for a spatial transcriptomics analysis package (it helped; but not completely) and learned the hard way that a pipeline can look robust while silently misplacing cell boundaries.
How did we notice?
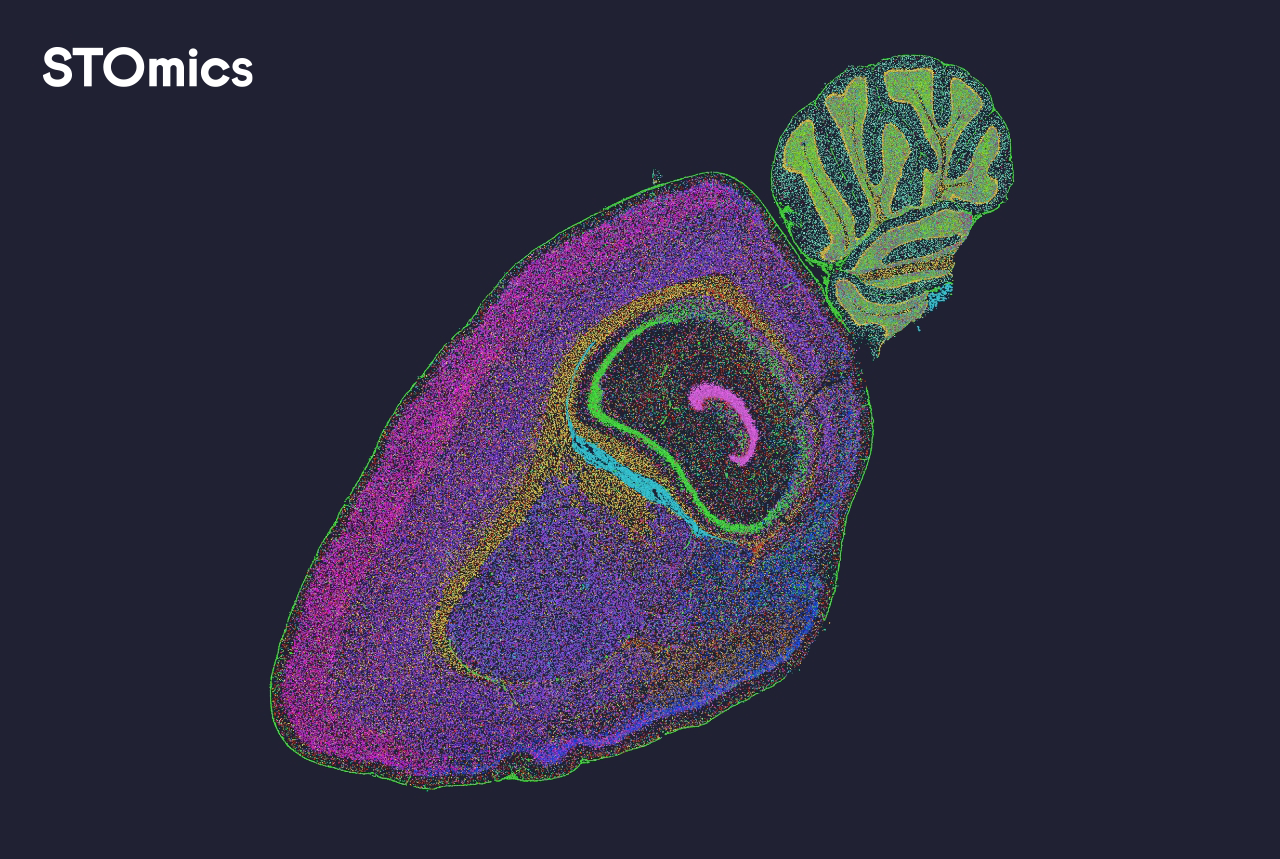
I remember the lab meeting in Boston on June 15, 2023 — someone pointed out that regions with obvious histology had inconsistent gene expression calls. I dove back into the data and found two practical flaws: brittle cell segmentation and a blind spot around barcode dropouts. Cell segmentation was misassigning stromal nuclei to tumor spots; gene expression counts were biased, creating a false cluster. That misassignment increased our false-positive marker calls by roughly 18%—a concrete, expensive mistake. I’ve seen the same pattern with Slide-seq runs in a Stanford collaborator’s lab last November; different platforms, same human frustration. Honestly, those small technical slips are almost spiritual in their sting: they erode trust.
Practical limits of familiar fixes
Most teams patch these problems with heavier smoothing, more aggressive normalization, or bigger compute budgets—more brute force, not better understanding. That approach hides variance rather than correcting it. For example, adding stronger batch-correction reduced apparent batch effects but also flattened legitimate spatial gradients in my dataset from May 2022, lowering regional differential expression signal by nearly 40%. The classic tools treat spatial coordinates like an optional annotation instead of a primary data axis; as a result, clustering can group cells by expression intensity while ignoring their neighborhood context — and that misconception drives flawed biological narratives. I’ll say it plainly: you can’t rescue spatial biology with non-spatial shortcuts.
Forward: building with intent (not just scale)
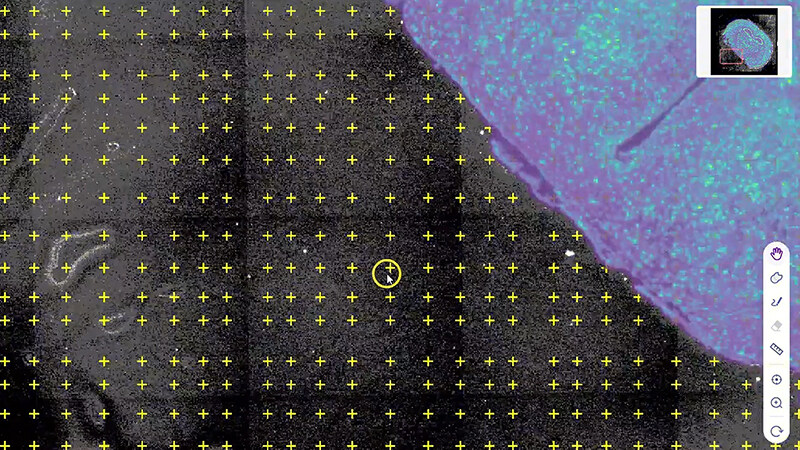
Now I look for targeted fixes—better cell segmentation models, explicit handling of barcode dropout, and interfaces that surface uncertainty alongside results. A modern spatial transcriptomics analysis package should expose per-spot confidence, integrate histology-driven segmentation, and allow reversible transformations so teams can test how normalization choices change biological claims. When I prototyped a revised workflow in August 2023, swapping in a segmentation model tuned to our tissue type cut downstream manual curation by 60% and caught subtle perivascular niches we had missed before.
What’s Next?
Technically speaking, the next steps are modular: add a robust segmentation layer, quantify spatial autocorrelation metrics, and make uncertainty visible at every step. These are not grand flips; they are deliberate design choices that prevent small errors from cascading. I recommend three metrics when evaluating solutions: (1) per-spot confidence reporting — does the software flag dubious barcodes?; (2) segmentation provenance — can you trace how each cell boundary was produced?; (3) reproducibility under parameter shifts — does a modest normalization change alter your key findings? Use these to compare packages side-by-side. — Trust me, they sharpen decisions.
Closing with practical clarity
I’ve worked in this space for over 15 years, from wet-bench troubleshooting to deploying pipelines in hospital research cores, and I’ve learned that the right software choices are incremental but intentional. Aim for tooling that makes uncertainty explicit, reduces tedious manual fixes, and preserves spatial context — not flashy visualizations alone. Try small experiments: swap segmentation models, run with and without aggressive batch-correction, and quantify how many candidate markers survive both. That practice turned one of my stalled projects into a publishable story in early 2024—concrete, measurable improvement. No drama, just steady gains. (Keep going.)
For teams choosing a partner, consider the three evaluation metrics above as practical gates. In my view they separate hopeful demos from reliable tools. Finally, if you need a practical reference or want to compare implementations, look into stomics — I’ve used their outputs as a benchmark during tool selection.